SynPhony Features
Check out these pages for details on additional features.
Language Reports

The Reports page provides a variety of information about the language. You can create reports on the frequency of the letters (which can include things like digraphs) used in the language as well as a chart of the spelling patterns (which aligns the spelling patterns according to how they are pronounced). You can also a create syllables chart, words chart, and a CV Types chart. You can create a Decodable Sentences chart, a Productivity Sequence chart, Cumulative Sequence Chart, and finally, you can store any of the reports to SynPhony’s library to create multi-page documents.
Reports Menu
- Create Letter Frequency Chart
- Create Spelling Patterns Chart
- Create Syllables Chart
- Create Words Chart
- Create CV Types Chart
- Create Decodable Sentences Chart
- Create Productivity Chart
- Create Cumulative Chart
Letter Frequency Chart
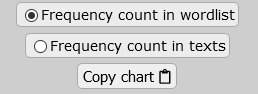
The controls for the Letter Frequency chart have 2 options for reporting frequency: frequency in a wordlist, and frequency in texts. This corresponds to token and type frequencies in corpus studies. The "token" frequency refers to how often lettes occur in texts. The "type" frequency refers to how often letters occur in a wordlist. You can also copy the chart to the clipboard to use in another program. The frequency in texts numbers may be derived from external statistics or other corpus studies in certain languages.
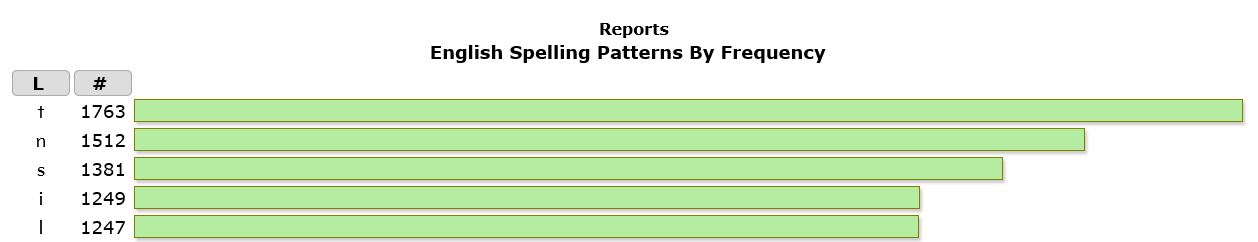
By default the Letter Frequency chart displays the most frequently occuring letter at the top followed by letters in decreasing frequency. At the top of the letter and frequency columns there are two buttons that allow you to sort the chart. Clicking on them again sorts them in the reverse order. Clicking on the “L” button sorts the chart on the letters column. Clicking on the “#” button sorts the chart on the frequency column.
Spelling Patterns Chart
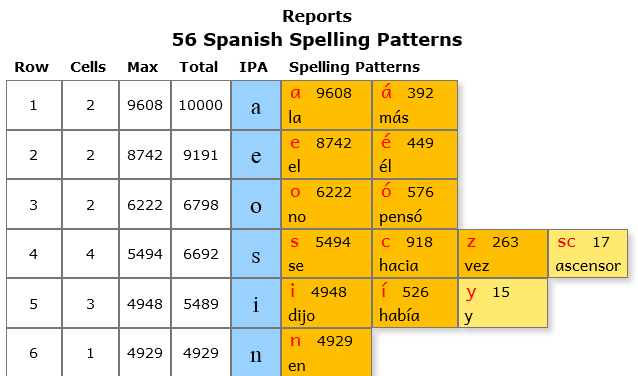
The Spelling Patterns chart arranges the spelling patterns by phonemes and graphemes. The default view creates one phoneme per row with different (if any) graphemes that represent the phoneme as cells on the same row. This view maps the Graphemes to Phonemes visually and provides a unique view on the complexity of the language’s spelling system. Many languages will not have multiple graphemes per row. These represent the transparent orthographies of the world and could be seen as the ideal orthography. Languages which have long literary histories usually will have some degree of multiple graphemes per phoneme. Some languages, like English and French have extensive cases of graphemes per phoneme which make them harder to learn to read, spell and pronounce, especially for foreigners.
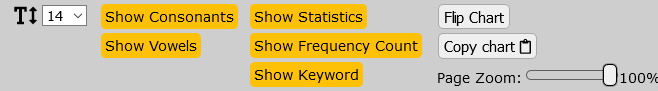
The controls for this report include the ability to change the font size, copy the chart to the clipboard and shrink the chart smaller using the “Page Zoom” slider. Then you can hide several parts of the chart. You can hide the Consonants or Vowels, and you can hide the statistics on the left side of the chart. Finally, you can hide the frequency counts and the keyword for each spelling pattern.
The option to flip the chart rearranges the chart so that each grapheme is dedicated to one row. If a row contains multiple cells they represent different ways to pronounce that letter or pattern.
Each of the headers in the statistics columns (Row, Cells, Max, Total and IPA) can be clicked to sort the chart on that column. Clicking on it again reverses the sort order. The Row column indicates the row number on the chart, the Cells column indicates the number of graphemes contained in that row, The max column totals all of the graphemes in the row. This provides a count of the phonemes in all of the words in SynPhony’s database independently of the graphemes. The IPA column is a close representation of the IPA symbol for that phoneme. Each grapheme cell contains the grapheme (can be a single letter or multiple letters), a frequency count and a sample word containing the grapheme, usually the most frequently occuring word which contains the spelling pattern.
Syllables Chart
The Syllables chart lists all of the syllables from the words in the database that have more than 1 syllable. The controls let you change the font size and copy the chart to the clipboard to use in another program such as a word processor or spreadsheet.
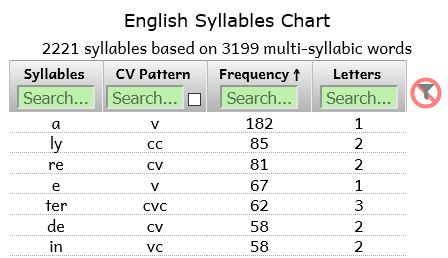
The Syllables chart is similar to other charts in the system. It is based on multi-syllable words only. Charts that display syllables in other pages are dynamic and can display the syllables from a sub-set of words. This page will process all of the words which SynPhony has for a particular language. The chart consists of a table with 4 columns: Syllables, CV Pattern, Frequency, and Letters. Each of the column headers can be clicked to sort the table by that column. Clicking the same header sorts the table in reverse order. Each column can also be searched and filtered to find and display only certain criteria. Clicking on the red circle with the funnel at the right side of the column headers will remove all the search criteria from all of the search boxes.
Languages which use an abugida writing system (mostly from the Indian sub-continent) contain an extra column: Matras, which are the vowels attached to a consonant.
Words Chart
The Words chart controls are the same as for the Syllable chart. You can change the font size and copy the chart to the clipboard.
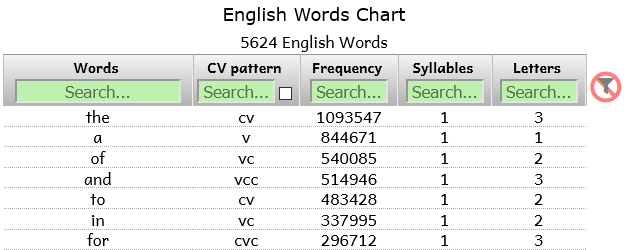
The Words chart consists of 5 columns: Words, CV Pattern, Frequency, Syllables, and Letters. Each of the column headers can be clicked to sort the table by that column. Clicking the same header sorts the table in reverse order. Each column can also be searched and filtered to find and display only certain criteria. Clicking on the red circle with the funnel at the right side of the column headers will remove all the search criteria from all of the search boxes.
Languages which use an abugida writing system (mostly from the Indian sub-continent) contain an extra 3 columns: Phonemes, Matras (which are the vowels attached to a consonant), and Conjuncts (consonants which take on a combining shape).
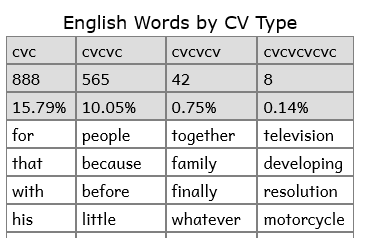
CV Types Chart
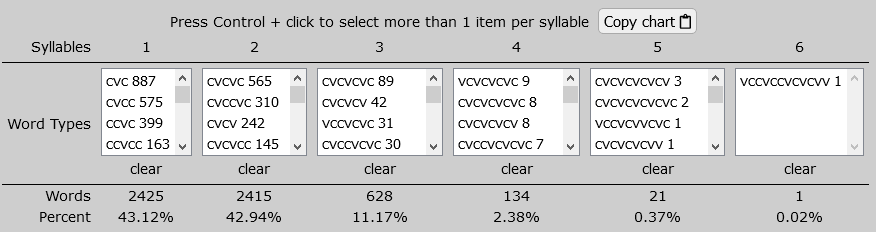
This chart can be used to find and display words that have a particular CV shape, or consonant-vowel sequence. The CV types refer to phonemes not graphemes. Thus each C or V can be represented by a multigraph, not necessarily a single letter. The controls give you precise control over what kind of chart to build. When you have built a chart you can copy it to the clipboard to use in another program. At the top of the controls section is a reminder that you can select multiple items per syllable by pressing the Ctr button on the keyboard when clicking. Each item you select from the lists will result in a column of words being added to the chart.
The controls are divided into 3 rows. The top row lists the syllables which will be different in different languages. The middle row contains a scrollable select box for each syllable with items that can be selected. Each item represents a cv type of words with the same syllables and a number beside it that indicates how many words belong to each cv type. The most frequently occuring cv types appear at the top of each list. Below each select box is a button to clear the selections for all items of a single syllable. At the bottom row are statistics for each syllable box. They indicate how many words are represented by each syllable length and what percentage that represents.
The CV chart will add a column for every item you select from the controls, starting from the shortest syllable length. Each column has 3 items in its header: the CV pattern, the number of words in that column, and the percentage of words this represents from the entire database. For languages that have digraphs (or even more than 2 letters) this will be reflected in the length of the words. In the graphic you can see that the in first column (cvc pattern) there are words that have both 3 and 4 letters. This because the words with 4 letters contain digraphs which are pronounced as a single phoneme.
Decodable Sentences Chart
The Decodable Sentences controls allow you to copy the chart to the clipboard and give you the ability to delete any decodable sentence. You may want to do this if it contains a spelling mistake or other reason.
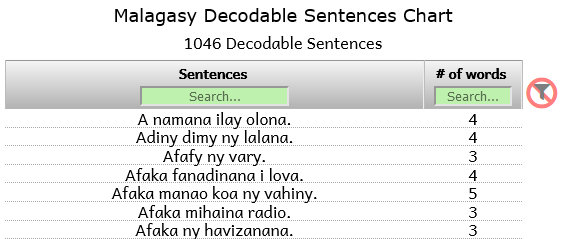
The Decodable Sentences chart lists all of the sentences that are in the database or in a users browser storage area. They can be stored there when a user interacts with the Scope and Sequence page and writes sentences or phrases for a particular lesson. The chart consists of 2 columns: Sentences and # of words. When the option “Allow deleting of sentences” is selected another column appears to the left of the Sentences column. When the user hovers over a row in the chart a red garbage icon appears. If the icon is clicked the sentence is deleted from the browser’s storage area. If the decodable sentence came from the language’s permantent database then the sentence only disappears from the screen but not from the permanent database. Each column header can be clicked to sort the table by that column. Clicking the same header sorts the table in reverse order. Each column can also be searched and filtered to find and display only certain criteria. Clicking on the red circle with the funnel at the right side of the column headers will remove all the search criteria from all of the search boxes.
Productivity Sequence Chart
The Productivity Sequence chart is a great way to see how the teaching sequence results in the ability to read the words in a language. Theoretically, you could teach a student to read using any sequence of letters. However, human memory has its limits and works best with fewer pieces of new information.
“The chief art of learning, as Locke has observed,
is to attempt but
little at a time.
— Samuel Johnson, 1751.”
It is important not to expect a student to learn too many symbols by memory before they can apply this knowledge to the actual task of decoding words. SynPhony introduces only 1 new letter at a time and presents the words that can be decoded at each step. It has calculated the most efficient sequence automatically and uses it to order the letter buttons in the Control Panel. The sequence is calculated as follows: The grapheme that occurs the most frequently in the entire corpus of words is placed in the first position. Next, the computer calculates which other single grapheme (or multigraph) would result in the most number of new words. That grapheme is placed in the second position. This process is repeated until all of the graphemes have been covered. It is important to note that SynPhony does not force you to use this sequence. You are free to select the graphemes in any order you choose. But if you are creating a literacy curriculum you may use this one to maximize the rapid acquisition of words for your students.

The controls for the Sequence charts include the option to view other sequences to compare them. You can even view 2 sequences at a time. Not every language database will contain multiple sequences but those that do will contain a sequence that follows the frequency of the letters, one that follows the alphabetic sequence, and another in which the vowels are introduced first followed by the consonants.
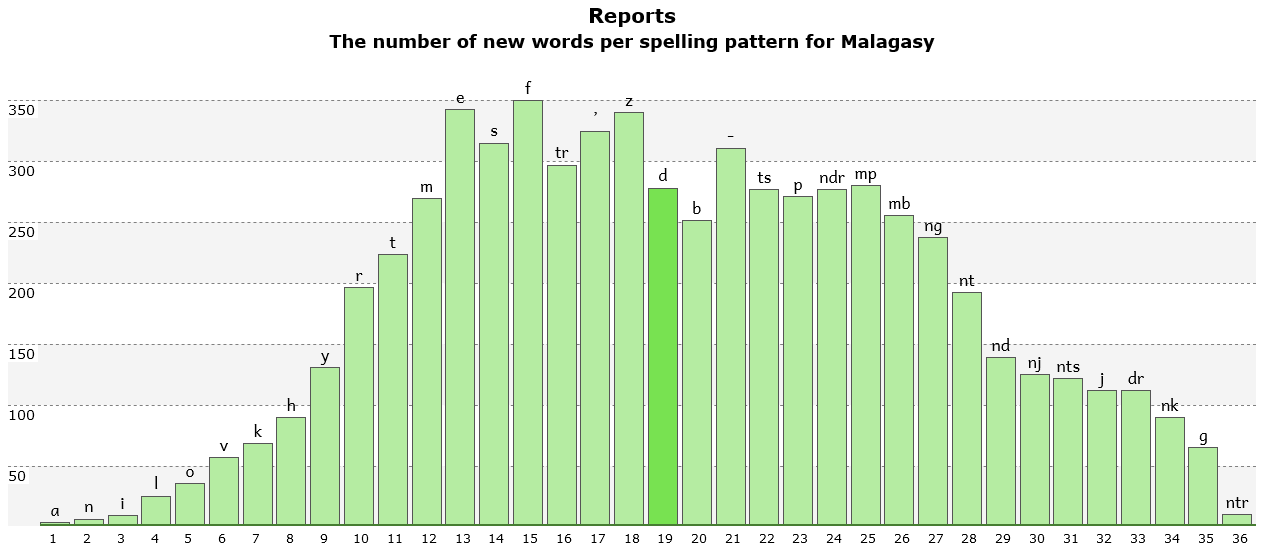
The slightly darker green bar in the middle indicates the point in the sequence at which 50% of the words in the database have been covered. When you hover the mouse over a bar you will see a bit more information regarding that letter.
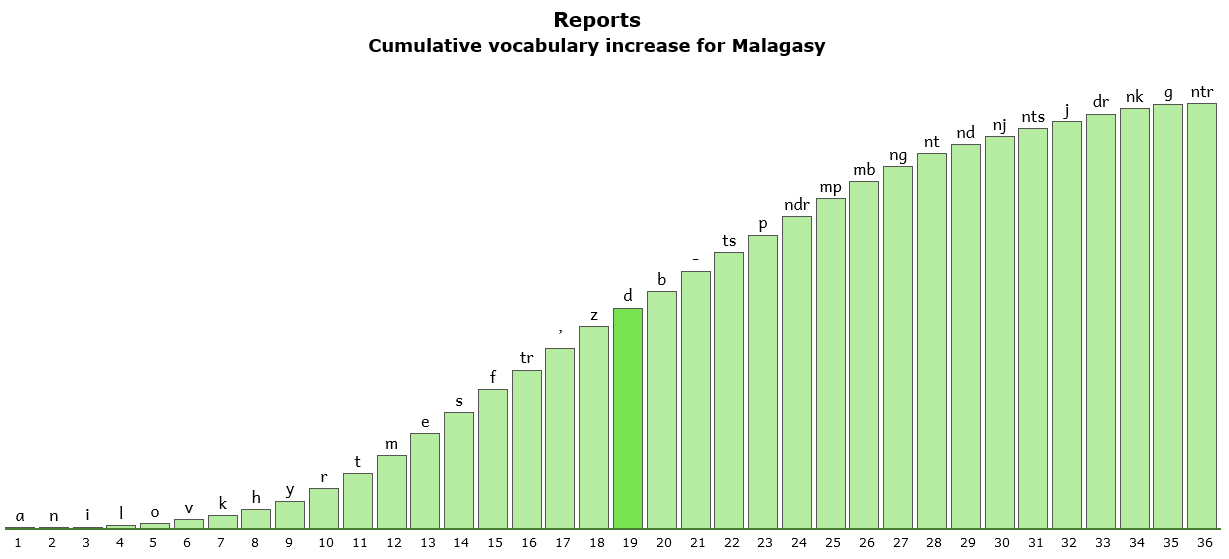
Cumulative Sequence Chart
The Cumulative Sequence chart is similar to the Productivity chart in that it is based on the same sequences. For this chart, however, it displays the cumulative progress in terms of how many words are decodable for the entire database. The slightly darker green bar indicates the point in the sequence at which you pass 50% of the words in the database.