Alphabetic code charts
Read this page to understand how to interact with the alphabetic code charts.
The alphabetic code charts display the orthographic complexity of a language. It consists of a header section at the top with buttons, a main table in the center of the page and a section to the left side that can be toggled off and on.
An ideal orthography uses 1 grapheme for 1 phoneme and always uses it consistently. Such an orthography would result in a very boring chart: a single column of spelling patterns matched to a single phoneme. Great for teaching literacy. But these charts have a perverse fascination: they are interesting to study but reflect the difficulty in mastering how to read and write in these languages.
The Chart Menu buttons
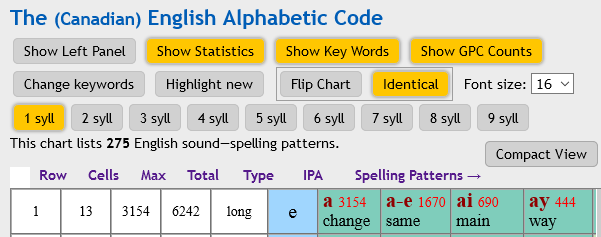
The button “Show Left Panel” toggles a panel on the left side of the page. This section contains additional features that are explained below.
The button “Show Statistics” toggles the left side of the main chart. These cells are coloured white and contain statistics about each row in the chart.
The button “Show Key Words” toggles the key word in each cell. This is usually a word which occurs the most frequently that also contains the spelling pattern in that cell.
The button “Show GPC Counts” toggles the frequency count number in each cell. This number indicates how many words contain the spelling pattern of that cell. This number should not be considered an absolute number but it does provide a relative frequency ranking in relation to the other patterns. It is based on the frequency count of an arbitrary corpus of words in that language.
When the button “Change Keywords” is selected and you add a new syllable length it may change the keyword. This will most definitely happen if you unselect the 1 syllable button and then select a longer syllable length button.
The button “Highlight new” will highlight a newly added cell when you select a longer syllable length.
The button “Flip chart” works in conjunction with the next button (Identical). This button will create a new table in which each row is dedicated to a grapheme, not a phoneme. When it is unselected the table goes back to the default in which each row is dedicated to one phoneme. If the button “Identical” is also selected then the table ensures that each grapheme in a row is identical. Otherwise, the table will dedicate each row to a letter in the alphabet. This means that if a spelling pattern contains a particular letter of the alphabet it will appear in the row. A multigraph will appear in multiple rows, once for each letter contained in the multigraph.
The Font size selector changes the font size for the chart.
The syllable buttons can include the GPCs and frequencies from specific syllable length groups.
The button “Compact View” toggles the menu between an expanded and compact view in order to maximise the viewing area for the chart.
Below the syllable buttons is a message that indicates how many spelling patterns are contained in the table. This will change depending on how many syllable buttons have been selected.
The Chart

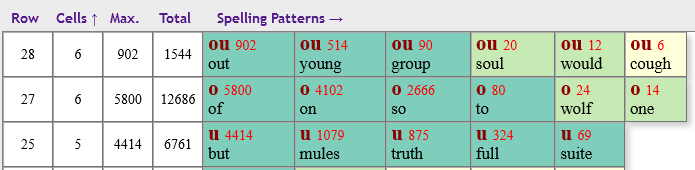
The rows in the chart can have different lengths so it will have a ragged right side. The column headers can be clicked and this will sort the chart on that column. Clicking on a header a second time will reverse the sort order. When a row has multiple spelling patterns they are always sorted from the greatest to the least frequent in occurence (moving from left to right).
The Phoneme row arrangement
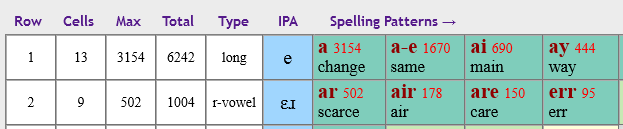
This is the default chart display and the one when the “Flip Chart” button is not selected. Each row in the chart represents one phoneme in the language and if it contains multiple (coloured) cells then each of them are pronounced the same as the other graphemes in the same row. Depending on the language this may only apply to a specific subset of the words with the specific grapheme. In the most extreme case the same grapheme can also appear in another row, but in that case it would be pronounced differently. All of the single English vowels and some of the consonants have this property.
If the button “Show Statistics” is selected then the chart will display 4 (for English 5) extra cells at the left side of the main chart. These cells have the headers: Row, Cells, Max, Total, (and for English Type). The numbers in the Cells column count how many graphemes are in each row. The Max contains the highest number from the frequency count for each grapheme in the row (always the left-most grapheme, next to the IPA cell). The Total number is the sum of all of the grapheme frequencies in the row. This number is also a frequency count of the phoneme in the language relative to the other phonemes based on the corpus of words that have been processed.
The Grapheme row arrangement
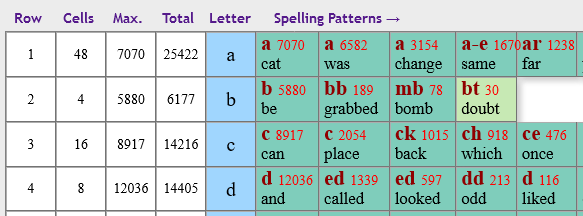
When you click on the “Flip Chart” button the chart is organized on a different principle. In this view, each row is dedicated either to a single letter of the alphabet or an identical spelling pattern.
Without the “Identical” button selected each row of the chart is dedicated to one letter of the alphabet. If there are multigraphs in the language then they will appear in multiple rows in the chart. For example, for the English digraph “th”, this spelling pattern will appear in the “t” and the “h” rows. So each row will contain instances of spelling patterns that contain a particular letter of the alphabet.
When the “Identical” button is selected then each grapheme in each row will be identical. This is useful when you want to see how many spelling patterns have multiple pronunciations.
You can sort the chart according to number of graphemes by clicking on the “Cells” column header (twice) to see the graphemes which have the most number of multiple pronunciations. Notice the up arrow beside the “Cells” column header.
The Left Panel
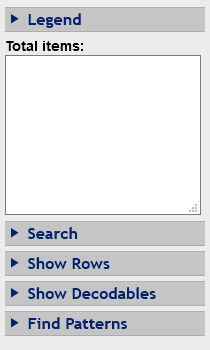
The left panel contains some extra features that will be different for various languages and various versions of these charts. Some of these features may not be available in the charts on the internet. The various sections in the left panel can be expanded and collapsed by clicking on the text labels. The text box can be used for input or for output for various functions described below.
The Legend explains the colours of the grapheme cells. The colours are set at arbitrary numbers to distinguish high frequency of occurence from medium and low frequency.
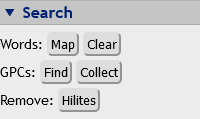
The Search section works in conjunction with the text box above it. If the page is linked to a database of words then you can paste a list or a paragraph into the text box and then click on the “Map” button. This will place the words into the cells which map to the grapheme or spelling pattern in the word. You can then click on the “Collect” button and the program will produce a table at the bottom of the left panel which will list all of the spelling patterns and their frequencies in the text or word list. You can copy the chart to the clipboard or press the “X” to delete it. This feature can give you an inventory of the spelling patterns of any amount of text. Clicking on the “Clear” button will remove the any mapped words from the chart. If you put a list of spelling patterns into the text box and click the “Find” button the program will highlight those spelling patterns on the chart. Clicking on the Remove Hilites button will remove the highlights.

The Display section lets you show or hide specific rows in the chart. If you want to see only the vowels or the consonants just select or unselect the appropriate button. If you want to see or hide the high, mid or low frequency spelling patterns just select the appropriate button.
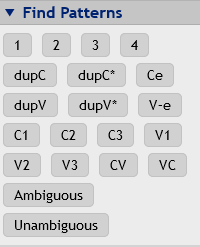
The Patterns section gives you the ability to highlight cells in the chart that have a particular pattern. The number and kinds of patterns available in this section will depend on the language. Some patterns include: the number of letters in the spelling pattern, duplicate consonants or vowels, duplicate letters with any other additional letters, consonant plus final “e”, split digraphs, single consonants, multiple consonants, single or multiple vowels, consonant+vowel combination, vowel+consonant combination and finally, all the ambiguous or unambiguous patterns.
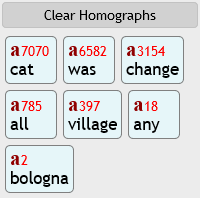
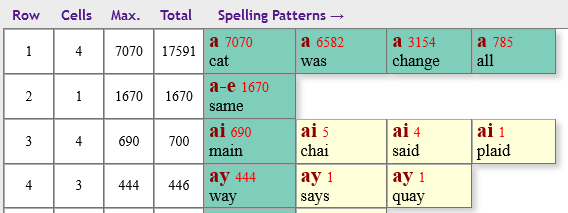
Some languages have instances where the same letter has different pronunciations. For example, the letter “c” can be pronounced either /k/ or /s/ in both English and Spanish. In these charts when you hover your mouse over a spelling pattern and it turns a different colour this is an indication that it is a homograph (same grapheme) with other graphemes in other rows. If you then click on that cell the program will collect all of the cells with the same grapheme and place them in the left panel at the bottom. In the graphic on the right a cell with the single letter “a” was clicked resulting in all of the cells which consist of a single “a” being collected and displayed in this area. As you can see from the keywords in each cell, each of these words contain the single “a” but in each word the “a” is pronounced differently. You can click on the “Clear Homographs” button to remove the chart from the screen.
Information about individual language charts
If anyone wants to do their own analysis and would like to know how I do it, please contact me and I will give you more information. If you would like to add another language to these existing charts I will give you complete credit. Please contact me.
English
The English chart represents the language that has been worked on the most. I am a Canadian and the analysis reflects my regional accent. I'm sure that other regional varieties of English would result in slight variations of this chart but I've never actually produced another chart for a different dialect. This would be an interesting project. In my analysis I don't have a “silent letter” category. In many people's minds English uses silent letters, like the final “e”. For my analysis, if a word contains a letter which does not get pronounced then I made a decision to group it either with the preceding or following letter which does have a pronunciation. The result of this choice is that there are more GPC categories than if I would have a silent letter category. It would also be an interesting project to make a chart in which there is a silent letter category. There can be different but equally valid ways to analyse the spelling patterns in English. For example, some people may not agree on having r-coloured vowels. I did include some but not all possible r-coloured vowels. Because the vowel quality is difficult to identify in most of these cases and difficult to separate from the “r”. Only in the case of long e + r (as in the word “ear”) did I separate them. This is because the long e is distinct and recognizably the same as the long e in the word “eel”.
Other analysis decisions had to be made about the final “le” in many words. Phonetically it is pronounced as /schwa + l/. I decided to analyse it as an /l/ and ignore the schwa. I also made a distinction between a long u and the palatalized u (as in the words: truth and mule). Another choice concerned the labialized schwa, as in the word “one” and “memoir”. In general my choices were influenced by pedagogical guidelines rather than purely linguistic principles.
French
I am not a French speaker but I had access to someone who grew up as a German-French bilingual living in Austria. She was able to work on the analysis for several months. Like my English analysis, the French analysis does not have a “silent letter” category. I do not claim any authoritative status for this chart but make it available so others can see it. You may very well disagree on some (or many) choices made in the analysis. If so, feel free to make your own analysis.
German
My first language is German, although it is no longer the one I'm most fluent in. German has a fairly regular orthography so it avoids many of the complexities of English. I didn't work on the analysis for very long and have not had a native speaker check my analysis for errors. I based it on standard High German which is what I am most familiar with.
Spanish
I had access to a Spanish speaker to help guide my analysis of this chart. He was not a native speaker but had lived in Mexico for many years. I recognize that there are many regional dialects of Spanish and this is probably closest to the Mexican variety.
Portuguese
I had some limited help with the Portuguese analysis from a Brazilian native speaker. Later I further refined the analysis wih help from someone from Mozambique.